
Dynamic Portfolio Analytics & Visual Model Book
Activate your edge.
Processed via SetupsGalore Core Engine — generated June 21, 2026
Setup Performance Matrix
| Setup | N | Win Rate | Avg R | Profit Factor |
|---|---|---|---|---|
| Levered ETF | 5 | 100.0% | +20.98R | ∞ |
| Unlevered Asset | 5 | 100.0% | +16.92R | ∞ |
Visual Trade Case Studies
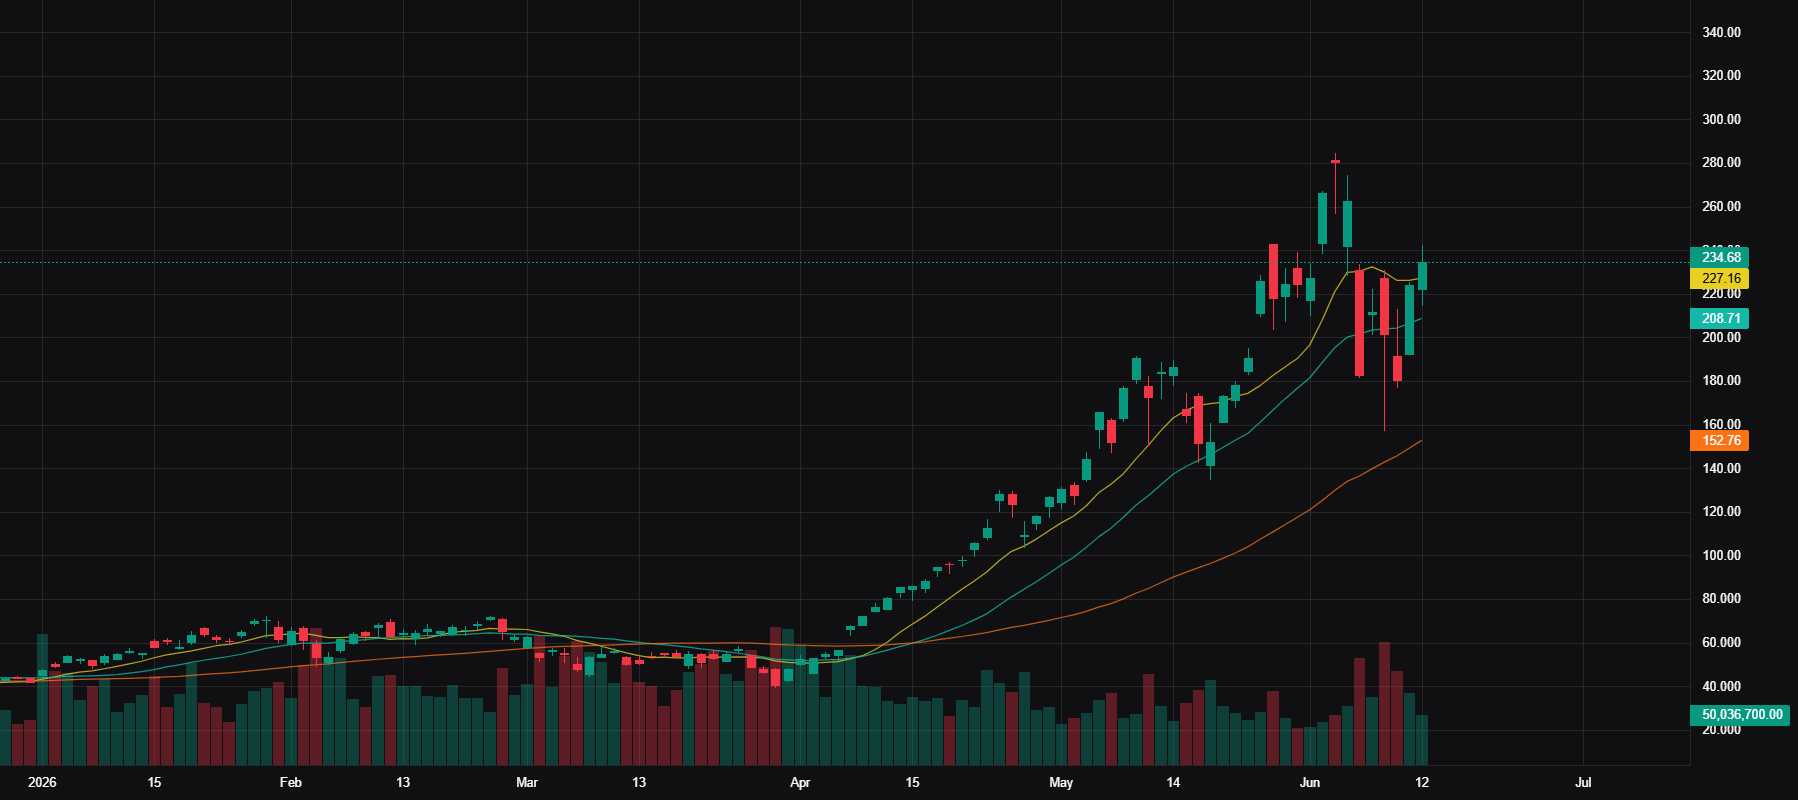
SOXL — 2026-04-08 — Levered ETF — long
Execution: Entry $65.77 | Exit $176.94 | Stop $63.56 | +50.30R | 30 days | 1.7%
Context: Vol 113% of 20d avg | ADR 10.7%
Advanced Chart
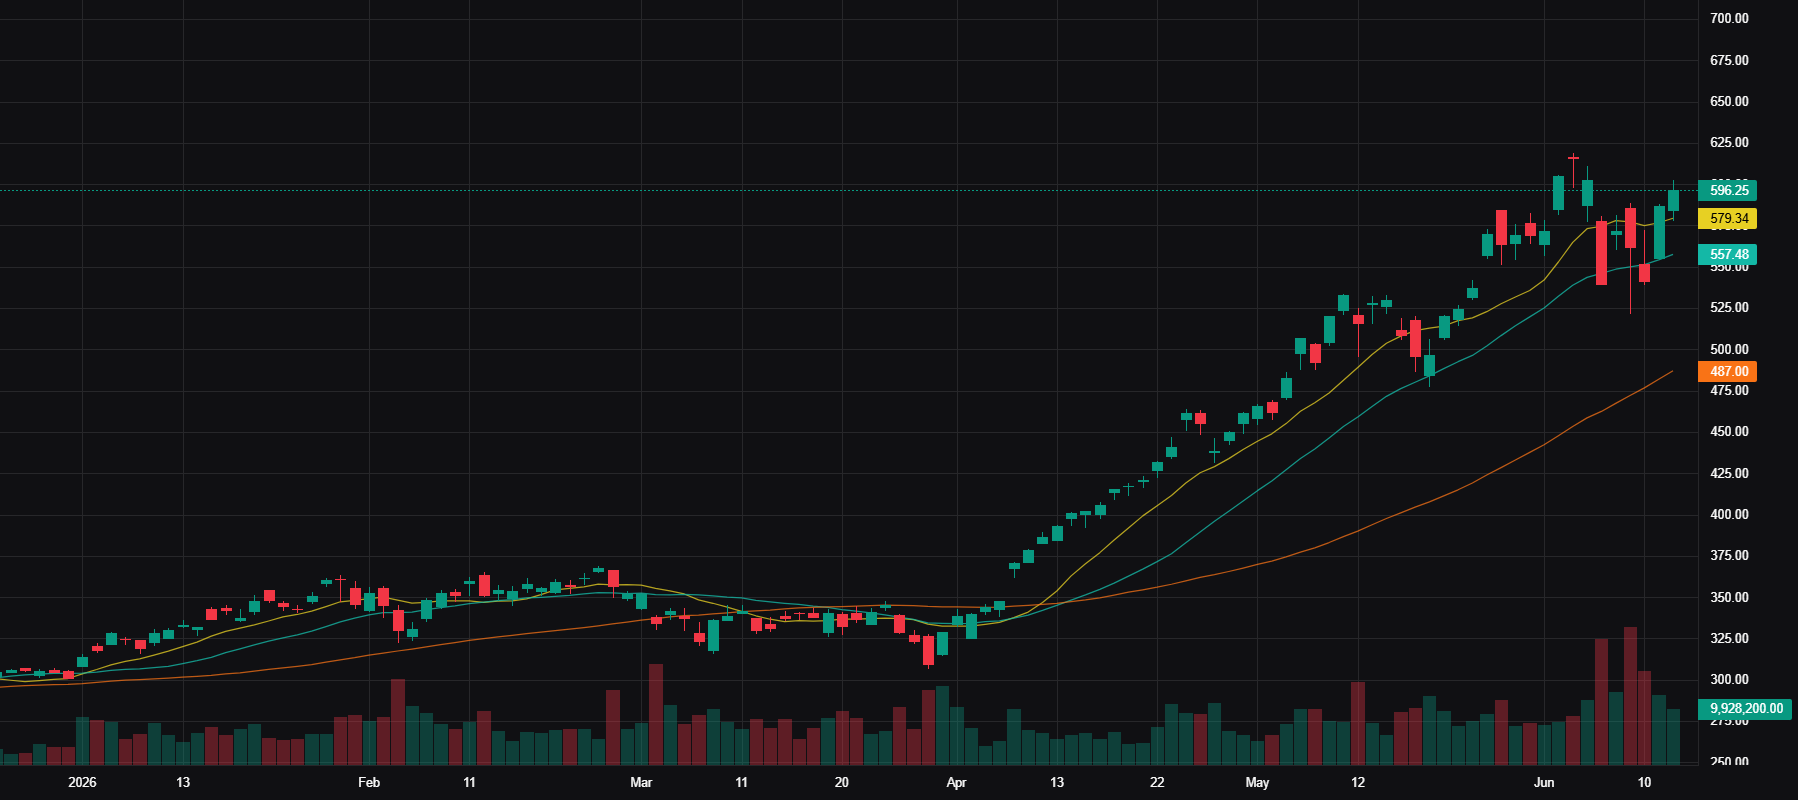
SOXX — 2026-04-08 — Unlevered Asset — long
Execution: Entry $366.64 | Exit $520.30 | Stop $362.13 | +34.07R | 30 days | 0.4%
Context: Vol 128% of 20d avg | ADR 3.4%
Advanced Chart
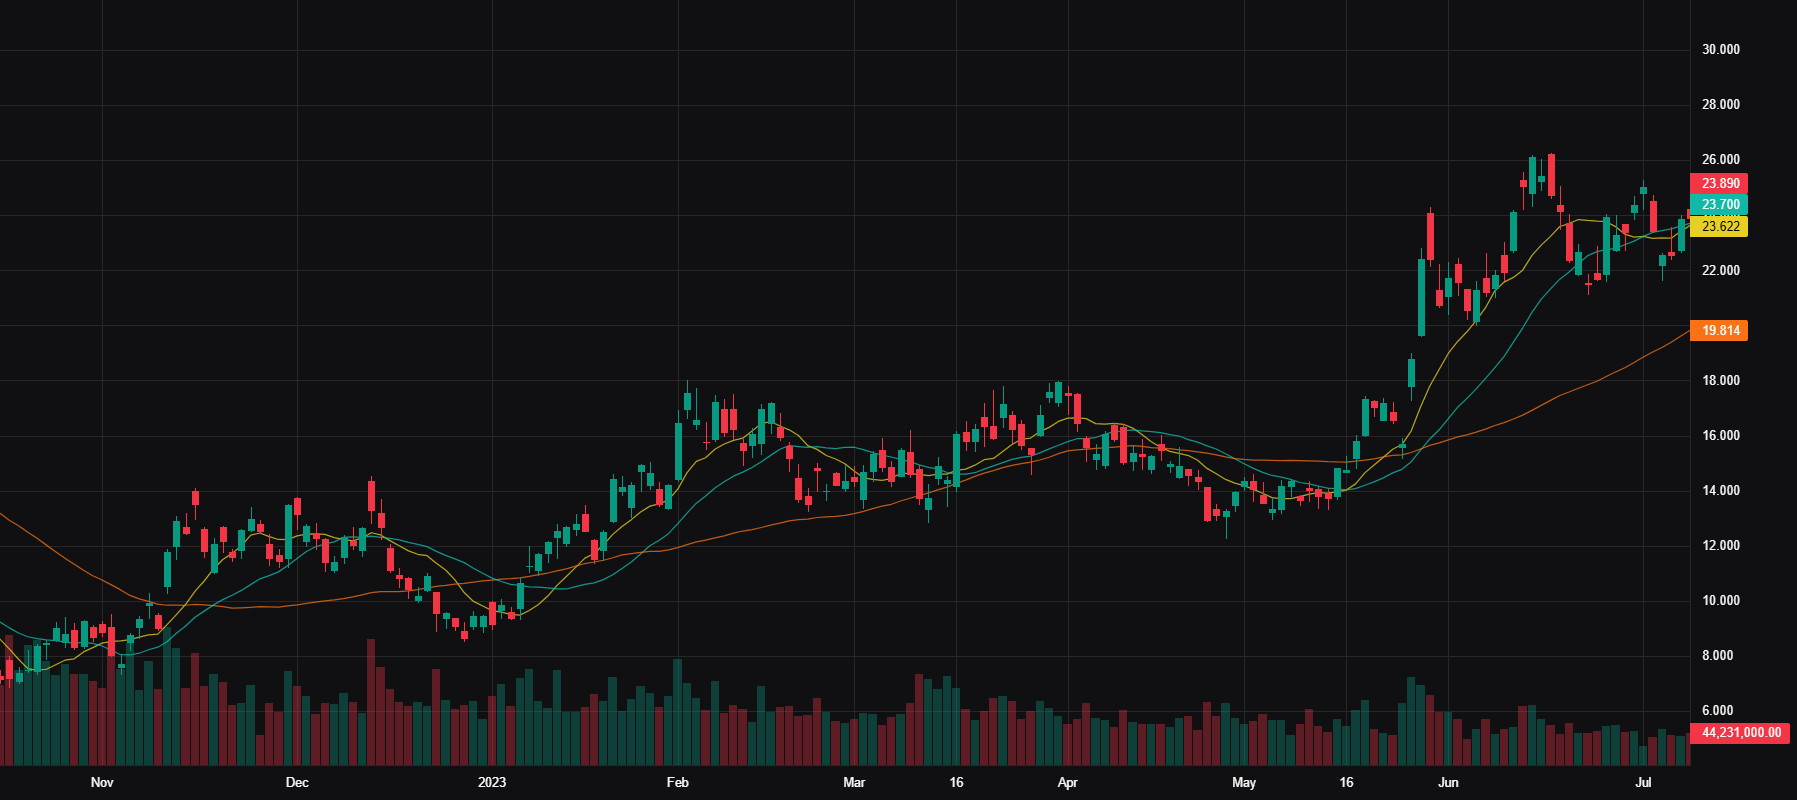
SOXL — 2023-05-15 — Levered ETF — long
Execution: Entry $14.26 | Exit $25.43 | Stop $13.69 | +19.48R | 31 days | 0.8%
Context: Vol 102% of 20d avg | ADR 5.9%
Advanced Chart
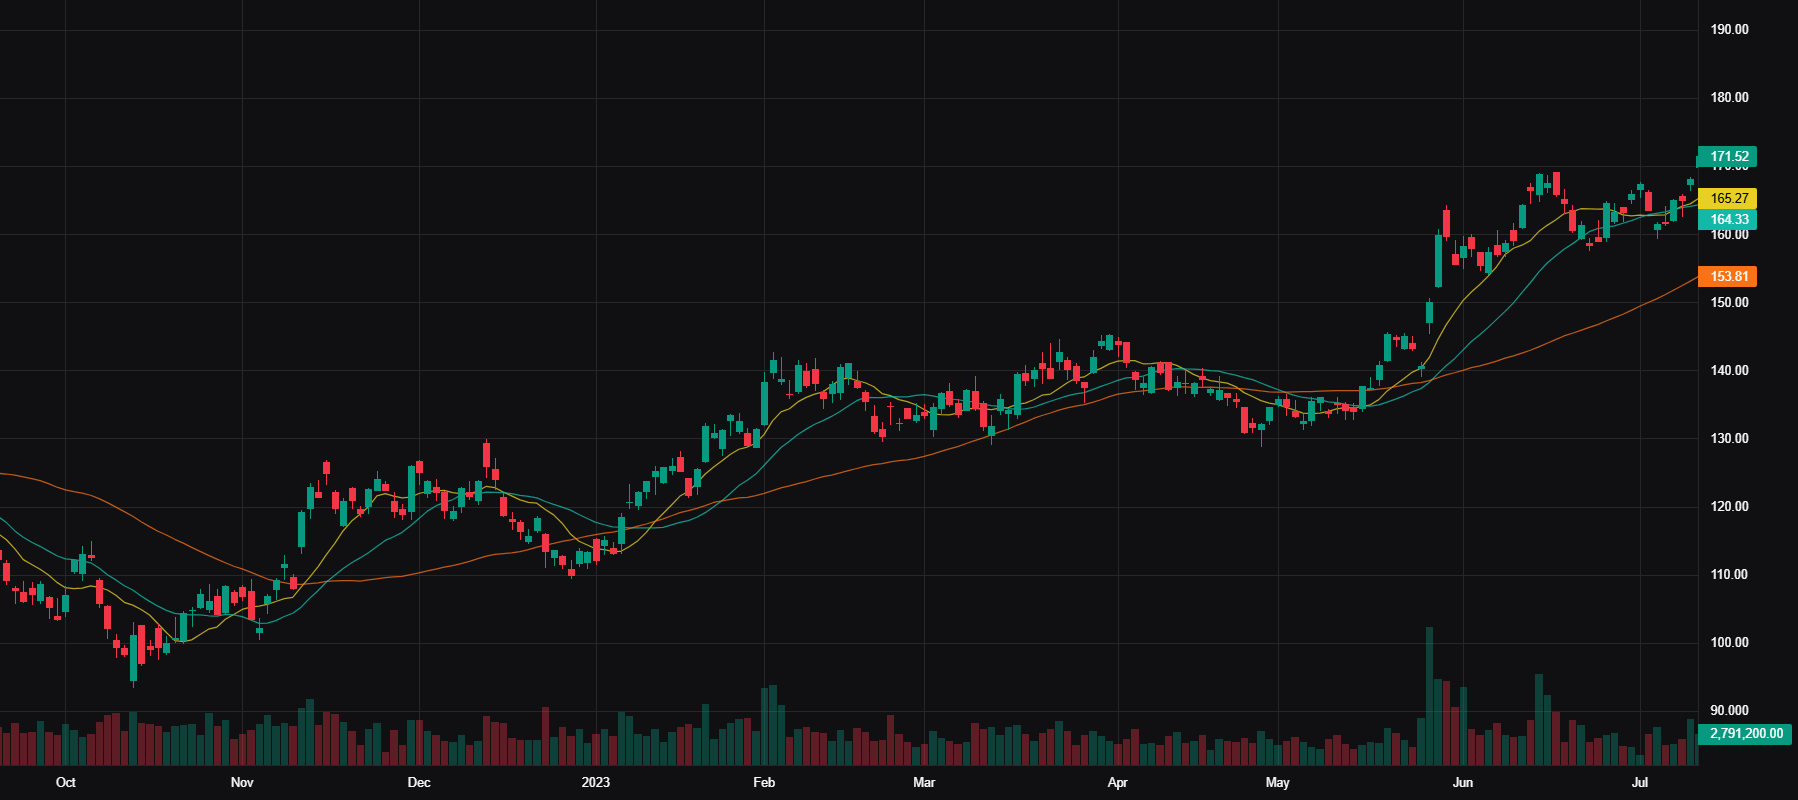
SOXX — 2023-05-15 — Unlevered Asset — long
Execution: Entry $135.89 | Exit $167.45 | Stop $134.05 | +17.16R | 31 days | 0.2%
Context: Vol 85% of 20d avg | ADR 1.9%
Advanced Chart
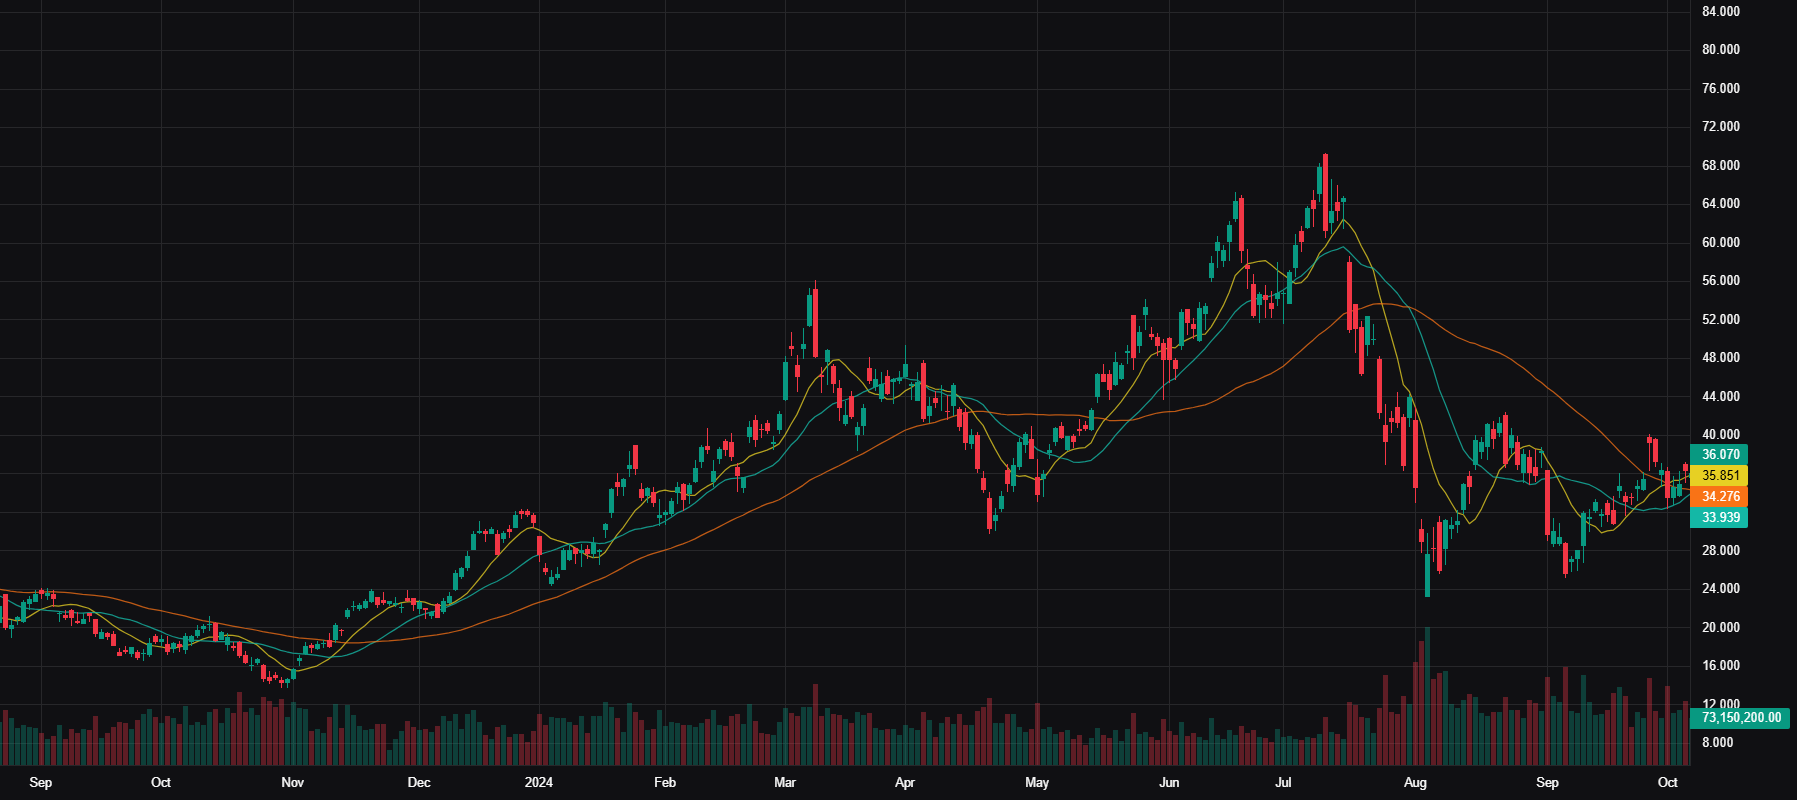
SOXL — 2024-05-14 — Levered ETF — long
Execution: Entry $41.66 | Exit $59.27 | Stop $40.48 | +14.94R | 31 days | 0.4%
Context: Vol 66% of 20d avg | ADR 6.2%
Advanced Chart
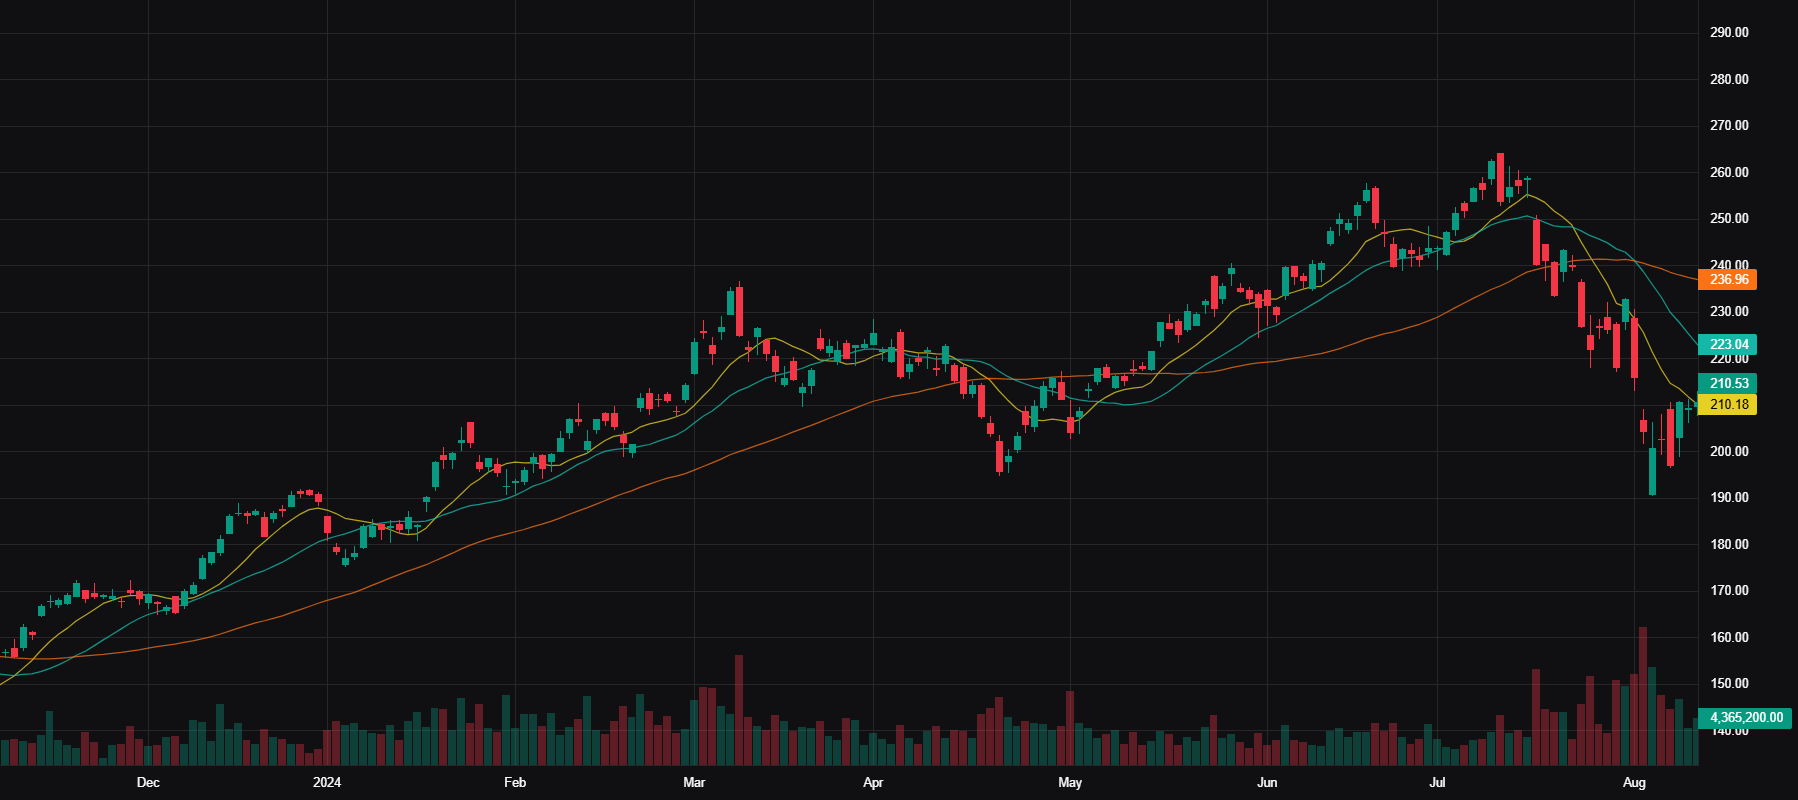
SOXX — 2024-05-14 — Unlevered Asset — long
Execution: Entry $219.58 | Exit $249.12 | Stop $217.49 | +14.11R | 31 days | 0.1%
Context: Vol 57% of 20d avg | ADR 2.0%
Advanced Chart
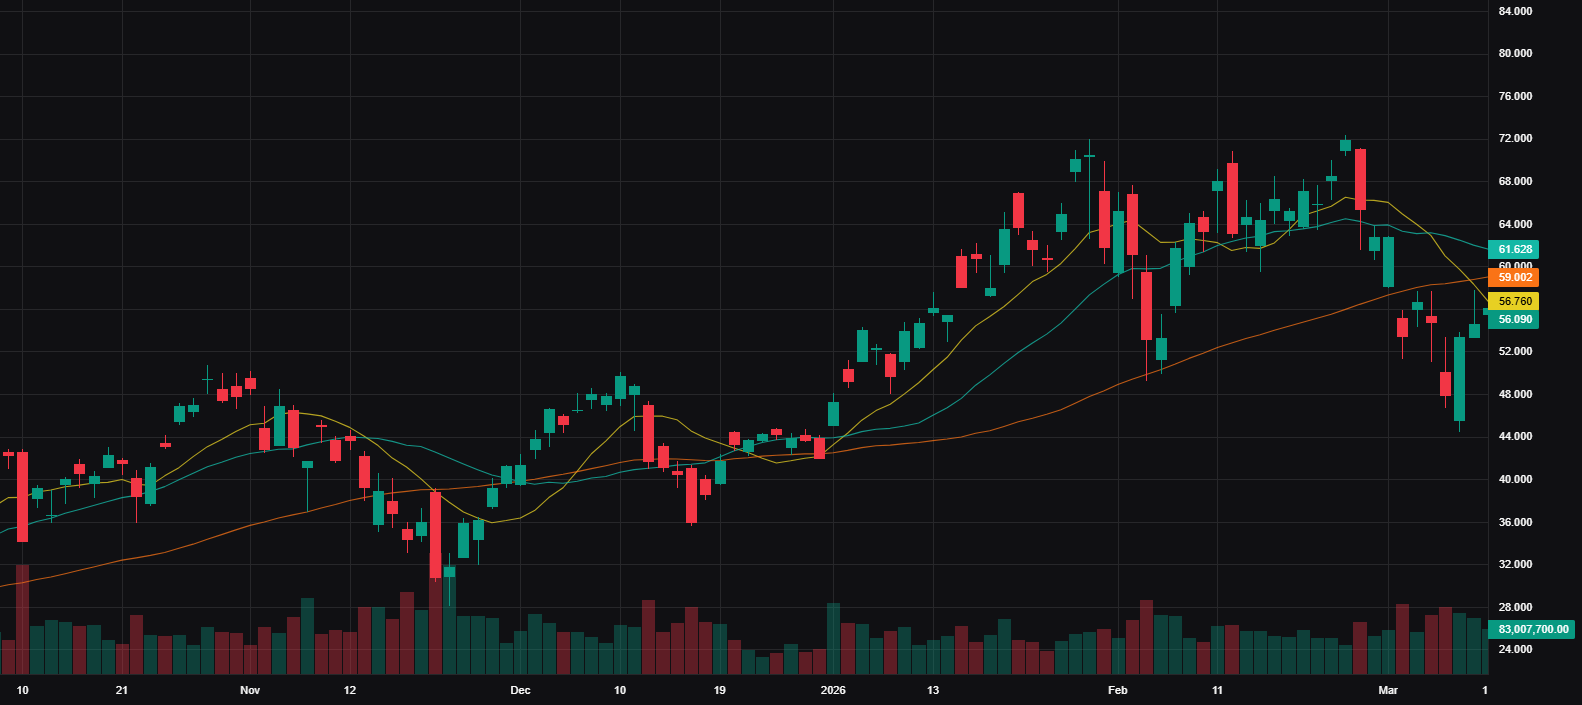
SOXL — 2026-01-02 — Levered ETF — long
Execution: Entry $46.59 | Exit $65.20 | Stop $45.08 | +12.37R | 31 days | 0.4%
Context: Vol 173% of 20d avg | ADR 6.3%
Advanced Chart
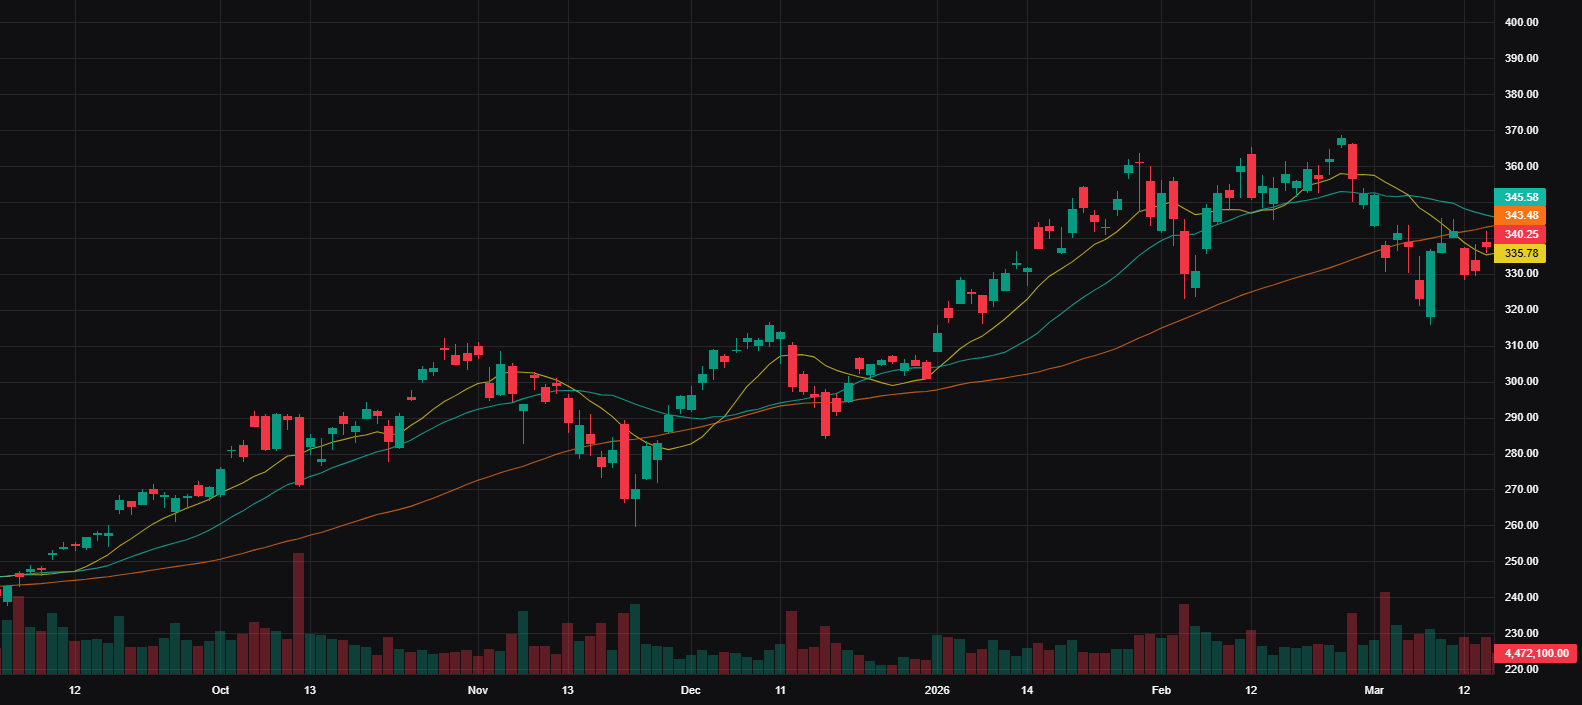
SOXX — 2026-01-02 — Unlevered Asset — long
Execution: Entry $311.99 | Exit $352.47 | Stop $308.37 | +11.17R | 31 days | 0.1%
Context: Vol 166% of 20d avg | ADR 2.0%
Advanced Chart
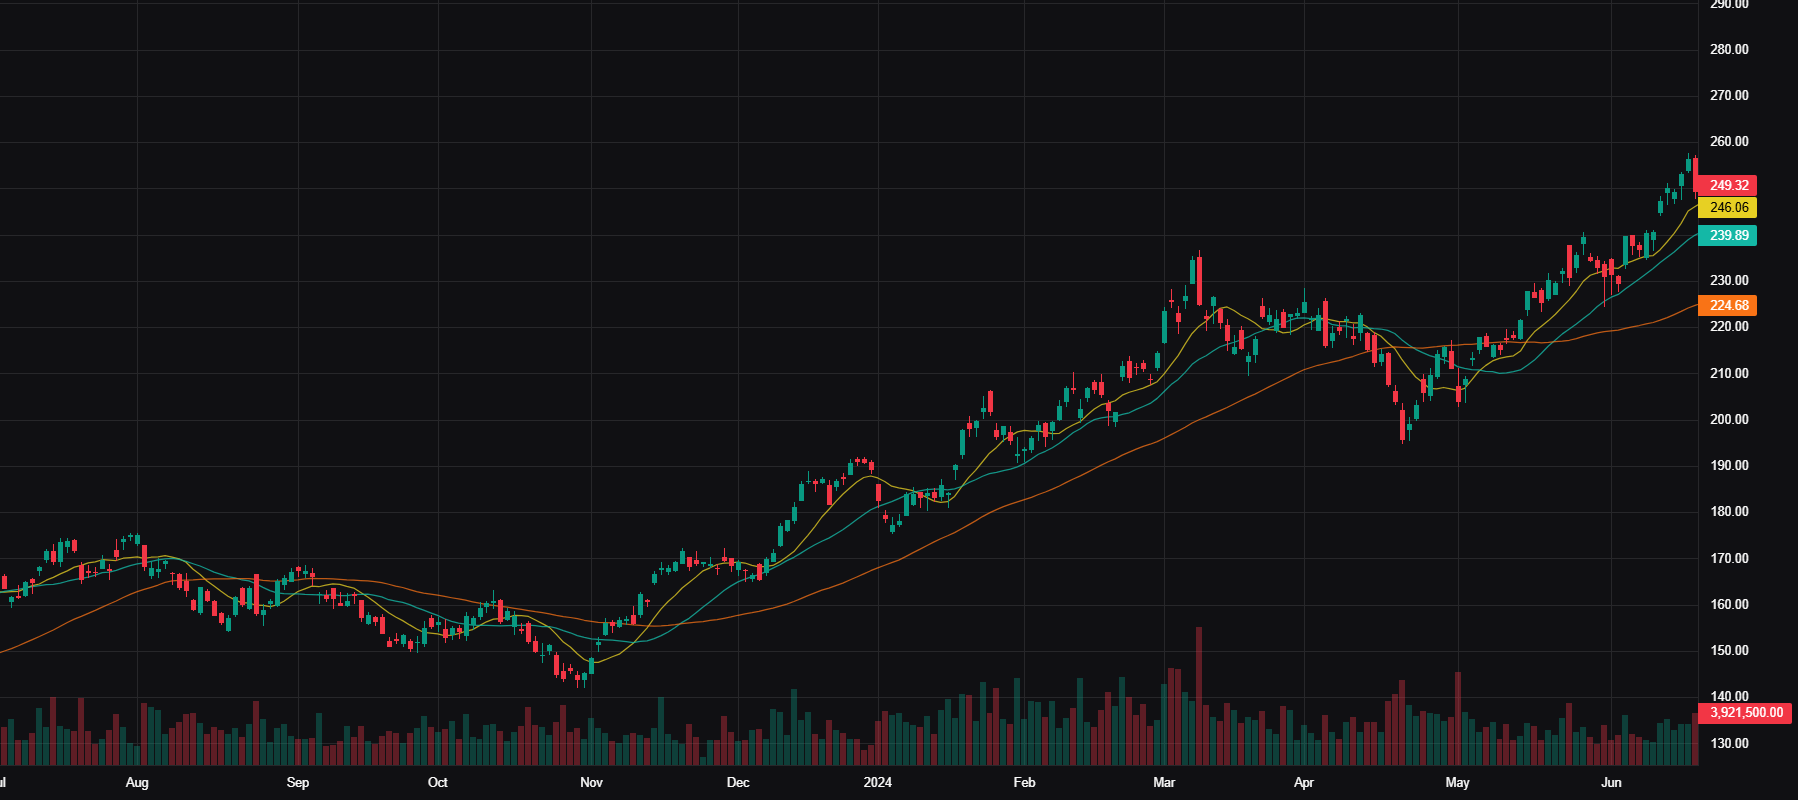
SOXX — 2024-01-18 — Unlevered Asset — long
Execution: Entry $188.81 | Exit $202.03 | Stop $187.18 | +8.10R | 33 days | 0.1%
Context: Vol 120% of 20d avg | ADR 1.9%
Advanced Chart
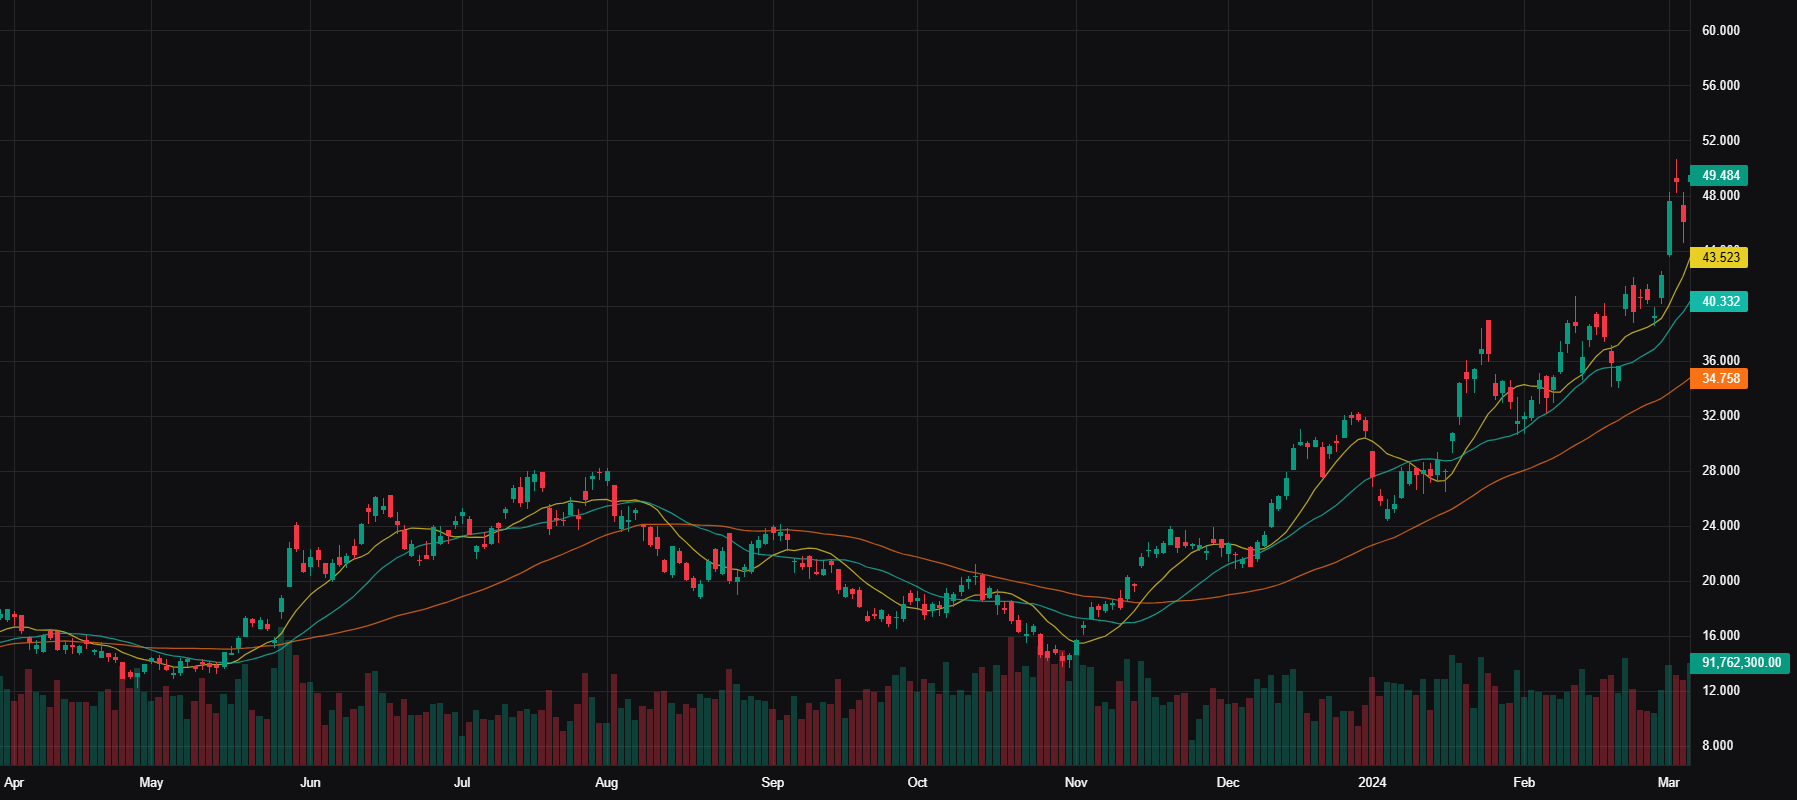
SOXL — 2024-01-18 — Levered ETF — long
Execution: Entry $30.11 | Exit $35.89 | Stop $29.37 | +7.81R | 33 days | 0.2%
Context: Vol 158% of 20d avg | ADR 6.1%
Advanced Chart
Key Lessons & Notes
No trade notes recorded.
Levered ETF vs. Unlevered Asset — R Capture & Exit Strategy Comparison
Core Performance Summary
| Metric | Levered ETF (SOXL) | Unlevered Asset (SOXX) | Difference |
|---|---|---|---|
| Trades | 5 | 5 | — |
| Win Rate | 100.0% | 100.0% | — |
| Avg R | +20.98R | +16.92R | +4.06R |
| Median R | +14.94R | +14.11R | +0.83R |
| Total R | +104.90R | +84.61R | +20.29R |
| Std Dev R | 16.93R | 10.16R | +6.77R wider |
| Avg Hold (days) | 31.2 | 31.2 | — |
Takeaway: Levered exposure added ~+4.06R on average per trade for identical setups and hold periods, but with significantly higher variance (std dev 16.93 vs 10.16). The outsized SOXL April 2026 trade (+50.30R vs +34.07R) accounts for much of the gap.
Trailing Stop R Capture — Levered vs. Unlevered
To isolate each group's performance under each exit rule, captured R is estimated using each setup's avg R scaled by the overall capture efficiency from the exit rules data.
| Exit Rule | Overall Avg R | Capture Efficiency | Est. Levered Avg R | Est. Unlevered Avg R |
|---|---|---|---|---|
| Actual Exit | +18.95R | 89.0% | +20.98R | +16.92R |
| Trail 20D | +17.79R | 83.5% | +17.53R | +14.13R |
| Trail 10D | +13.88R | 65.2% | +13.68R | +11.03R |
| Trail 50D | +8.80R | 54.8% | +11.50R | +9.27R |
| Trail 5D | +6.98R | 32.8% | +6.88R | +5.55R |
| Trail 100D | +5.31R | 33.1% | +6.94R | +5.60R |
| Trail 200D | +6.27R | 38.5% | +8.08R | +6.52R |
Note: Est. Levered/Unlevered R = setup avg R × (exit rule capture efficiency ÷ actual exit capture efficiency). This preserves relative scaling per group since trade-level exit simulation is not available in the dataset.
Key Observations
| Dimension | Levered ETF | Unlevered Asset |
|---|---|---|
| Best trailing stop | Trail 20D (~+17.53R est.) | Trail 20D (~+14.13R est.) |
| Worst trailing stop | Trail 5D (~+6.88R est.) | Trail 5D (~+5.55R est.) |
| R left on table vs actual (Trail 20D) | ~−3.45R | ~−2.79R |
| Volatility risk (Std Dev) | High — wide swings | Moderate — more consistent |
| Leverage premium (actual exit) | +4.06R per trade | Baseline |
The Trail 20D stop is the closest mechanical alternative to the actual exits across both groups, sacrificing only ~3–4R while removing discretionary exit risk. The levered setup consistently outperforms its unlevered counterpart under every exit scenario, but the higher standard deviation means drawdown exposure during the trade is meaningfully greater in SOXL positions.